

Elevation
[?]
Elevation of a city refers to the height above sea level at which the city is located, measured in meters.
131
Population
[?]
This is a town's official population, measured each year by the national statistics authority.
27200
Real Population (5km)
[?]
Our "Real Population" metric reflects more accurately a town's real size by including inhabitants in the immediate vicinity of the town's official borders.
110000
Air Quality Rating
[?]
Based on PM10, PM2.5, NO2, SO2, and ozone levels. Higher scores indicate cleaner air.
92
Region
Veneto
Walkability
Walker’s Paradise
Housing availability
[?]
Based on total number of properties (sale and rent) classifies housing availability into five categories: low, relativel ylow, medium, relatively high and high.
Relatively High
Avg Download Speed (Mbps) / Avg Upload Speed (Mbps)
193
/ 104
Climate Description
Balanced temperatures, consistent rainfall; enjoys sunny days, minimal snow and cool winters.
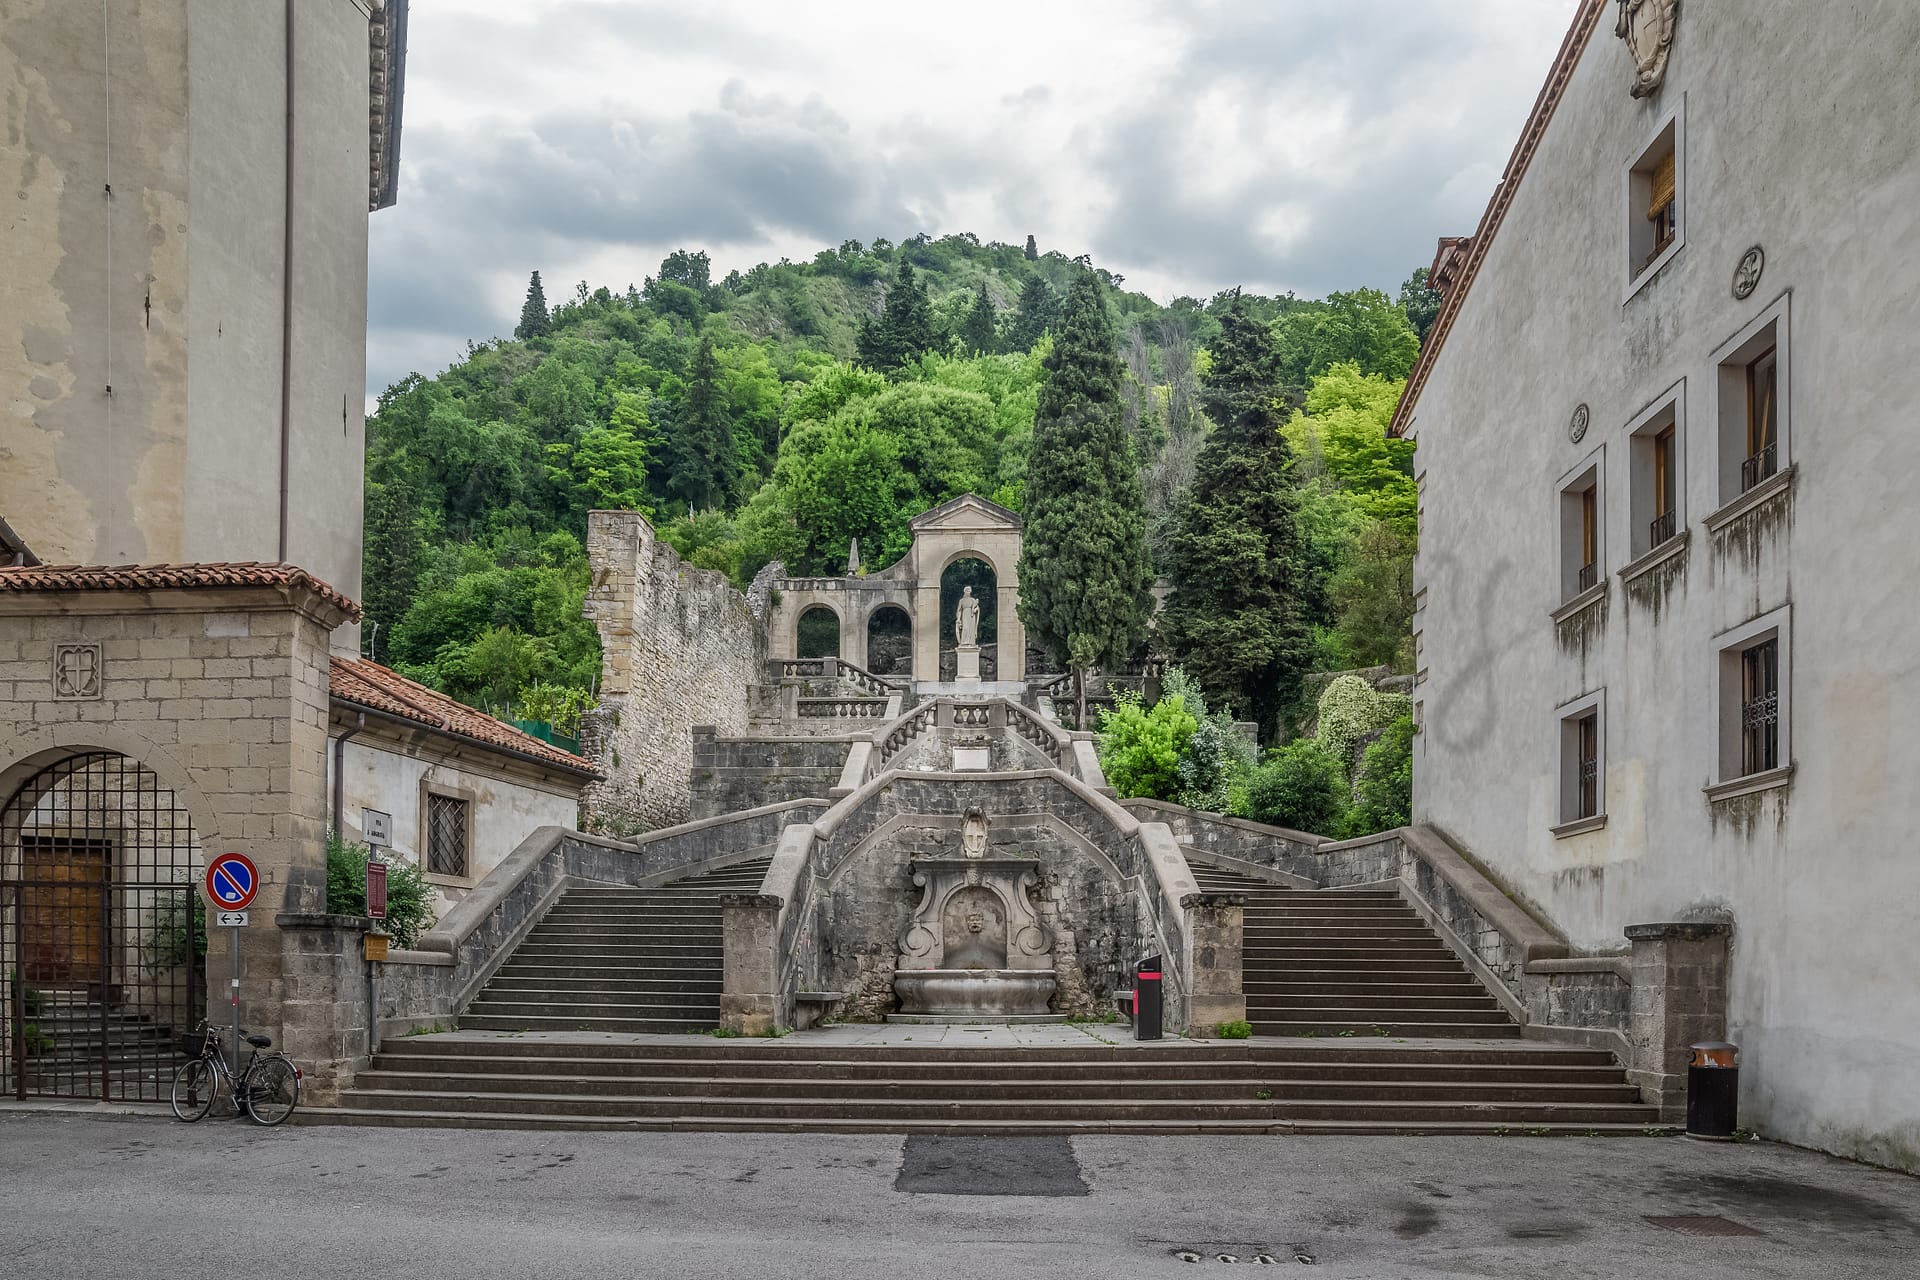
Vittorio Veneto
Veneto
Quality of Life Score
[?]Factors in air quality, amenities, walkability, population, and environmental risks. Higher scores suggest better living conditions.
93
Quality of Infrastructure
[?]Measures internet speed, healthcare access, airports, rail, and walkability. Higher scores mean better connectivity and essential services.
100
Quality of Economy
[?]Based on income, property prices, job availability, and population density. Higher scores indicate stronger economic conditions.
77
Vittorio Veneto Demographics
Population
[?]
This is a town's official population, measured each year by the national statistics authority.
27200
Real Population (5km band)
[?]
Our "Real Population" metric reflects more accurately a town's real size by including inhabitants in the immediate vicinity of the town's official borders.
110000
Births Per 100 Deaths
40.0
Population Data Source
ISTAT,2023
Estimated Unemployment Rate
Touristy Index
[?]
Calculation of tourist density index for the city, comparing its total tourist number to the overall average tourist number of the region
relative to its own population.The index indicates how a location’s tourist density compares to the average, with values above
100 representing higher-than-average density and values below 100 representing lower-than-average density.
Not Touristic
Income per capita (2023)
[?]
This is an estimation of average income per resident for this town, based on 2023 data from the Italian Ministry of Finance.
23400
Income rank in Italy (2023)
[?]
This is a ranking of the town's average income per resident, against the full list of townships in Italy.
1406 out of 7901
Infrastructure and Connectivity
Create an account to explore more
This content is for Members only | Already a Member? Sign in
Closest Airport
Name
Antonio Canova (Treviso)
Connectivity Score
[?]
Measures travel time and service quality of nearby airport stations. Higher scores mean better transport access.
7
Driving Time
33min(s)
Antonio Canova (Treviso) Airport is located about 3 km from Treviso and 31 km from Venice, serving as an accessible alternative to Venice Marco Polo Airport. With over 3 million passengers annually, it caters primarily to European destinations, being a focus city for low-cost carrier Ryanair which offers direct flights to cities such as Alicante, Berlin, and Budapest. This airport is recognized for its budget-friendly connections within Europe, mainly serving leisure travellers heading to or from the Veneto region, including popular routes to Southern Europe and Eastern Europe.
2nd Closest Airport
Name
Marco Polo (Venice)
Connectivity Score
[?]
Measures travel time and service quality of nearby airport stations. Higher scores mean better transport access.
8
Driving Time
35min(s)
Venice Marco Polo Airport (VCE) is situated in Tessera, part of the Venice municipality, approximately 7.6 kilometres from Mestre and Venice. The airport is a focus city for airlines like Ryanair and easyJet, with scheduled flights to 90 destinations in 35 countries, including key European cities as well as seasonal routes to the US, Canada, Korea, and the Middle East. Renowned for its water transport links, the airport provides straightforward access to Venice, enhancing connectivity for both leisure and business travellers.
3rd Closest Airport
Name
Friuli Venezia Giulia (Trieste)
Connectivity Score
[?]
Measures travel time and service quality of nearby airport stations. Higher scores mean better transport access.
7
Driving Time
64min(s)
Friuli Venezia Giulia Airport, also known as Trieste Airport, is located near Ronchi dei Legionari, Italy, serving the Trieste region in north-eastern Italy. It has seen substantial growth in passenger numbers, with key routes to major European cities like Frankfurt, Milan, Rome, and Barcelona, and serves as a hub for Ryanair. Notable for its intermodal transit hub, the airport offers convenient railway and road connections, enhancing accessibility and making it a vital gateway for international and domestic travellers.
Closest Rail
Name
Stazione di Vittorio Veneto
Connectivity Score
[?]
Measures travel time and service quality of nearby rail stations. Higher scores mean better transport access.
6
Driving Time
3min(s)
Train service at Stazione di Vittorio Veneto offers regional rail lines connecting the station to key destinations including Venice, Conegliano, Treviso, and Verona. The main train operators serving this station are Trenitalia and other regional services.
2nd Closest Rail
Name
Stazione di Soffratta
Connectivity Score
[?]
Measures travel time and service quality of nearby rail stations. Higher scores mean better transport access.
6
Driving Time
6min(s)
Train service at Stazione di Soffratta includes the following features:
– **Rail Lines**: Main rail services include connections to Treviso and Venice.
– **Key Destinations**: Direct trains connect Soffratta to significant destinations such as Venice and Treviso.
– **Train Operators**: The primary operator is Trenitalia.
– **Frequency of Departures**: Trains to Venice run approximately every 20 minutes, while services to Treviso operate approximately every 4 hours during the day.
– **Type of Service**: Stazione di Soffratta primarily serves regional trains, with no high-speed services available.
3rd Closest Rail
Name
Stazione di Santa Croce del Lago
Connectivity Score
[?]
Measures travel time and service quality of nearby rail stations. Higher scores mean better transport access.
7
Driving Time
18min(s)
Train service at Stazione di Santa Croce del Lago includes the following:
– **Rail Lines:** The station serves the regional rail network connecting various destinations primarily in the Veneto and Friuli Venezia Giulia regions.
– **Key Destinations:** Direct trains from the station connect to key destinations such as Belluno (approximately 24 minutes), Venezia Mestre (approximately 1 hour 16 minutes), Milan (approximately 3 hours 46 minutes), and Treviso (approximately 48 minutes). There are about 13 trains daily to Belluno, Venezia Mestre, Ponte Nelle Alpi-Polpet, and Treviso.
– **Train Operators:** The primary operator is Trenitalia, which offers the regional services at this station.
– **Frequency of Departures:** Trains generally depart frequently, with approximately 13 services daily to several destinations including Belluno and Treviso, and up to 23 departures to Milan throughout the day.
– **Train Types:** The station offers regional trains primarily; there do not appear to be high-speed trains servicing this station.
Overall, Stazione di Santa Croce del Lago provides robust regional connections with a well-distributed schedule throughout the day.
Infrastructure & Amenities
Create an account to explore more
This content is for Members only | Already a Member? Sign in
Within 10km
Auto Repair Shops
91
Bars
126
Cafes
48
Cinemas
4
Dentists
10
Golf Courses
2
Gyms
24
Health Clinics
10
Hiking Trails
14
Historical Sites
109
Libraries
2
Museums
14
Parks
15
Pharmacies
21
Restaurants
79
Shopping Centres
4
Supermarkets
51
Spas
74
Beach
Name
Area Verde Comunale
Driving Distance
9mins
Water Quality Rating
1 - Excellent
Mountain Resort
Name
Alpe del Nevegal
Driving Distance
30.0mins
Healthcare
Create an account to explore more
This content is for Members only | Already a Member? Sign in
Healthcare Score
[?]
Evaluates hospital/clinic access, drive time to care, and regional quality rankings. Higher scores mean better healthcare.
94.0
Nearest Hospital Name
Pres. Osp. di Vitt. Veneto-P.
Drive Time to Nearest Hospital
4 minutes
Hospitals and Clinics Within 10km
2
Healthcare Quality Description
In this area of Veneto, healthcare services demonstrate a varied performance. Overall, the regional healthcare quality is above average for Italy. Local hospital care, however, requires improvement. In specific measures, trauma services excel, with high timeliness in fracture treatment and quick intervention for severe heart attacks. Surgical efficiency is notable for short post-operative recovery times. Nonetheless, areas such as minimally invasive procedures for breast cancer and readmissions following cardiac conditions are identified as needing significant enhancement. This mixed profile indicates strengths in emergency and procedural efficiency, alongside clear opportunities for progress in specialised and continuity care.
Local Public Healthcare Provider
AZIENDA ULSS N. 2 MARCA TREVIGIANA
Safety
Seismic Zone (risk of earthquakes)
[?]
Official seismic zones classify areas based on earthquake risk.
High Earthquake Risk
Road Accidents Rate per 10k Inhabitants
[?]
Calculation of road accidents per 10,000 people based on the number of deaths and injuries registered in roads for year 2022 for the city.
39
Percentage of Population at Landslide Risk
[?] Percentage of the population in high or moderate landslide risk zones. Higher values indicate greater environmental risk.
Percentage of Population at Flood Risk
[?] Percentage of the population in high or moderate flood risk zones. Higher values indicate greater environmental risk.
Car Insurance Price Index
[?]
The car insurance price index is a measure of how a city's average car insurance premium compares to the national average,
expressed as a percentage. A value of 100 indicates that the city's premium is equal to the national average.
Values above 100 show higher premiums, while values below 100 show lower premiums.
101.576
Housing & Property Market
Create an account to explore more
This content is for Members only | Already a Member? Sign in
Housing availability
[?]
Based on total number of properties (sale and rent) classifies housing availability into five categories: low, relativel ylow, medium, relatively high and high.
Relatively High
Property Prices per m²
[?]
Calculation of property sale prices per square meter for apartments, houses in the city.
Median (50th Percentile): The midpoint price, where half the values are above and half below.
First Quartile (25th Percentile): The price below which 25% of properties fall.
Third Quartile (75th Percentile): The price below which 75% of properties fall.
First Quartile
610
Median
1042
Third Quartile
1479
Connectivity & Digital Access
Create an account to explore more
This content is for Members only | Already a Member? Sign in
Walkability Description
Walker's Paradise
Avg Download Speed (Mbps)
193
Fast Download Speed (Mbps)
277
Slow Download Speed (Mbps)
90
Education
Create an account to explore more
This content is for Members only | Already a Member? Sign in
Avg Schools Ranking (All Criteria)
[?]
This ranking shows in which decile the town's public schools fall while looking at all the indicators provided by the Italian Ministry of Education for the most recent available year. Note that figures are only provided by the ministry at the school catchment area level, and therefore several schools may be grouped together.
Top 30%
Avg Schools Ranking (Standardised Tests)
[?]
This ranking shows in which decile the town's public schools fall while looking the students' results in national standardised tests. The data is provided by the Italian Ministry of Education for the most recent available year.
Top 20%
Counts of School
Error
There was a problem with your SQL connection - Please contact the administrator
There was a problem with your SQL connection - Please contact the administrator
Climate & Weather
Create an account to explore more
This content is for Members only | Already a Member? Sign in
Precipitation
[?] Based on daily climate data for precipitation from OPEN-METEO this parameter indicates how a city's annual precipitation compares to others in terms of percentage, with values ranging from 0 (lowest) to 1 (highest). For example, a percentile rank of 0.75 means the city's total precipitation is higher than 75% of other cities.
High (71st-80th percentile)
Sunshine
Low (11th-20th percentile)
Snowfall
Average (41st-50th percentile)
Min Annual Temperature (°C)
[?] This parameter represents the monthly average of daily minimum temperatures for January, based on data from OPEN-METEO.
-0.3
Max Annual Temperature (°C)
[?] This parameter represents the monthly average of daily minimum temperatures for January, based on data from OPEN-METEO.
27.2
Climate Description
Vittorio Veneto, nestled in Italy, experiences a temperate climate that balances all seasons with distinctive characteristics. Winters are marked by gentle snowfall, cloaking the town in serene white without overwhelming its residents. As spring approaches, the temperatures moderately rise, allowing an amiable transition into warmer months. The town enjoys a generous amount of clear, sunny days throughout the year, ideal for those who value sunlight in their daily routines. Summers are pleasantly warm, rarely reaching extreme heat, thus providing comfortable conditions for both leisure and outdoor activities. The rainfall is well distributed across the year, supporting lush landscapes without causing significant disruptions to daily life. This climatic harmony makes Vittorio Veneto a compelling choice for expats and retirees seeking a stable, yet vibrant weather environment.
Annual Temperature Chart (Min)
Error
There was a problem with your SQL connection - Please contact the administrator
There was a problem with your SQL connection - Please contact the administrator
Annual Temperature Chart (Max)
Error
There was a problem with your SQL connection - Please contact the administrator
There was a problem with your SQL connection - Please contact the administrator
Sunny Days By Month
Error
There was a problem with your SQL connection - Please contact the administrator
There was a problem with your SQL connection - Please contact the administrator
Environmental & Air Quality
Create an account to explore more
This content is for Members only | Already a Member? Sign in
Classifications
PM10
[?]
PM10 levels indicate Good air quality at 0–20 µg/m³, Fair at 20–40 µg/m³, Moderate at 40–50 µg/m³, Poor at 50–100 µg/m³, Very Poor at 100–150 µg/m³, and Extremely Poor at 150–1200 µg/m³.
Fair
PM2.5
[?]
PM2.5 is Good if PM2.5 levels are between 0–10 µg/m³, Fair between 10–20 µg/m³, Moderate between 20–25 µg/m³, Poor between 25–50 µg/m³, Very Poor between 50–75 µg/m³, and Extremely Poor between 75–800 µg/m³.
Fair
NO2
[?]
NO₂ levels are considered Good at 0–40 µg/m³, Fair at 40–90 µg/m³, Moderate at 90–120 µg/m³, Poor at 120–230 µg/m³, Very Poor at 230–340 µg/m³, and Extremely Poor at 340–1000 µg/m³.
Good
SO2
[?]
SO₂ levels indicate Good air quality at 0–100 µg/m³, Fair at 100–200 µg/m³, Moderate at 200–350 µg/m³, Poor at 350–500 µg/m³, Very Poor at 500–750 µg/m³, and Extremely Poor at 750–1250 µg/m³.
Good
O₃
[?]
For O₃, the air is Good at 0–50 µg/m³, Fair at 50–100 µg/m³, Moderate at 100–130 µg/m³, Poor at 130–240 µg/m³, Very Poor at 240–380 µg/m³, and Extremely Poor at 380–800 µg/m³.
Fair
Air Quality Rating
[?]
Based on PM10, PM2.5, NO2, SO2, and ozone levels. Higher scores indicate cleaner air.
92
Air Quality Description
Vittorio Veneto in Italy offers a generally pleasant living environment when it comes to air quality. Key pollutants such as nitrogen dioxide and sulphur dioxide are maintained at satisfactory levels, indicating good air quality in these respects. However, particulate matter levels, including PM10 and PM2.5, though fair, do record margins that merit moderate caution among mainly sensitive groups or those with specific health considerations. Ozone levels also register within a fair range, suggesting occasional periods of concern particularly relevant for those active outdoors. This picture supports a largely comfortable setting for those considering relocation here, particularly expats and retirees seeking a balance between urban and natural environments.
Vittorio Veneto in Italy offers a generally pleasant living environment when it comes to air quality. Key pollutants such as nitrogen dioxide and sulphur dioxide are maintained at satisfactory levels, indicating good air quality in these respects. However, particulate matter levels, including PM10 and PM2.5, though fair, do record margins that merit moderate caution among mainly sensitive groups or those with specific health considerations. Ozone levels also register within a fair range, suggesting occasional periods of concern particularly relevant for those active outdoors. This picture supports a largely comfortable setting for those considering relocation here, particularly expats and retirees seeking a balance between urban and natural environments.
Town Descriptions
Create an account to explore more
This content is for Members only | Already a Member? Sign in
Getting There
Vittorio Veneto boasts strong transport connectivity, facilitated by nearby train stations and main road links. The A27 and national roads enhance accessibility, while the Antonio Canova and Marco Polo airports serve as key travel hubs, both located a short distance from the town center.
Getting Around
Local Cuisine
Vittorio Veneto, located in the Veneto region of Italy, presents a rich culinary scene that reflects its local traditions and international influences. The cuisine is characterized by traditional dishes such as Bigoli, a thick pasta, Duck Ragu (Sugo D’Anatra), and Tiramisu, which is famous worldwide. The local flavors are complemented by Radicchio di Treviso and various seafood due to its proximity to the Adriatic. The town offers a blend of dining options ranging from local trattorias, where authentic regional dishes are served, to international cuisine establishments catering to diverse palates. Notably, Vittorio Veneto boasts ‘Le Macine,’ a Michelin-starred restaurant known for its exceptional quality and creativity in regional cooking. This melding of traditional and modern dining experiences positions Vittorio Veneto as an appealing destination for culinary enthusiasts.
Shopping Overview
The shopping landscape includes specialty and gift shops, art galleries, and farmers’ markets. Expats and retirees can find a range of local products, artisanal goods, and seasonal produce. Supermarkets and convenience stores serve daily needs, while outdoor markets provide a vibrant atmosphere for food and crafts. The city offers boutique shopping, catering to those seeking unique items beyond typical retail outlets.
Neighborhoods
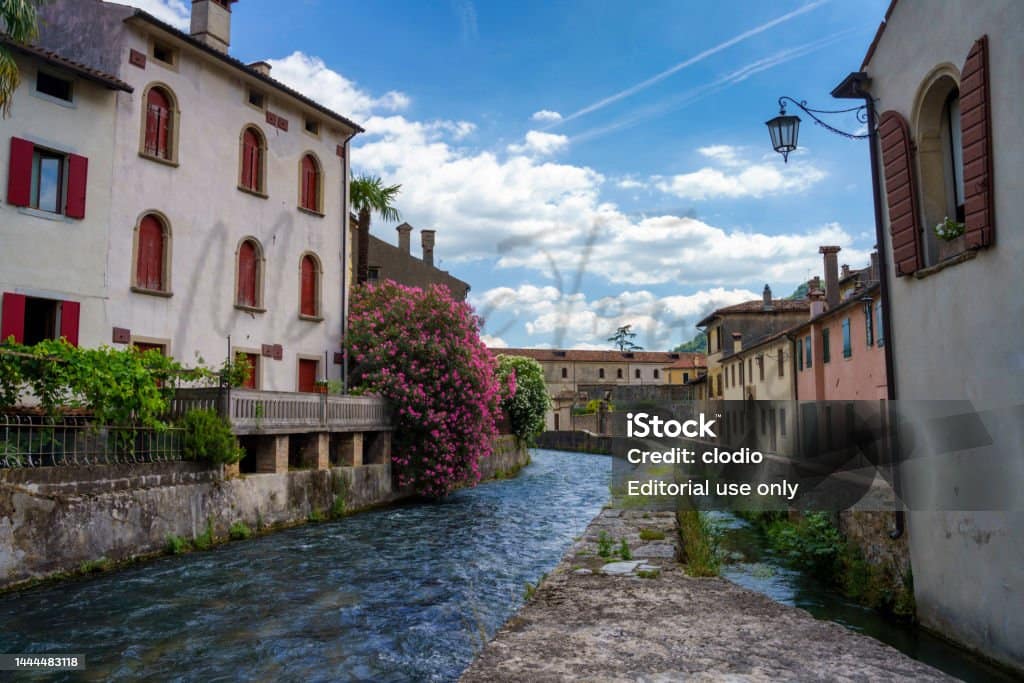
Green Areas and Parks
Vittorio Veneto offers a range of outdoor activities suitable for various preferences. Among the notable green areas, Lago Morto and Laghi Blu provide serene environments for nature enthusiasts. For hiking, the Serravalle – Anello di Sant’Augusta trail presents a moderate challenge over 5.7 miles. Those seeking more arduous treks can opt for the Madonna dell’Agnelezza, covering 10 miles with significant elevation gains. Mountain biking enthusiasts might explore the demanding Forcella Zoppei to Malga Van – Pian de le Femene path. These trails present opportunities for year-round recreation amidst the natural beauty of the Veneto region.
✅ Pros
– High-quality healthcare services available for residents.
– Excellent infrastructure supports easy commuting and accessibility.
– Pleasant climate with warm summers and mild winters.
– Rich cultural and historical backdrop to explore and enjoy.
– Low unemployment rate ensures a stable local economy.
– Non-touristic environment fosters a peaceful living experience.
– Integration opportunities with friendly local community and expats.
– Clean air quality enhances overall well-being and health.
– Reliable internet connectivity for remote work or leisure.
– Access to quality educational facilities for families and individuals.
❌ Cons
– Limited nightlife options might leave some nightlife seekers disappointed.
– Small-town charm may feel too quiet for some residents.
– Language barrier can complicate daily interactions for newcomers.
– Public transportation options may be limited outside main routes.
– Some local services may have reduced hours or availability.
– Cultural activities may not always cater to diverse interests.
– Seasonal weather changes can affect outdoor lifestyle preferences.
– Limited selection of international cuisine may frustrate foodies.
– Local events may not match the vibrancy of larger cities.
– Integration into local community can take time and effort.
FAQs
Summary
✅ Pros
– High-quality healthcare services available for residents.
– Excellent infrastructure supports easy commuting and accessibility.
– Pleasant climate with warm summers and mild winters.
– Rich cultural and historical backdrop to explore and enjoy.
– Low unemployment rate ensures a stable local economy.
– Non-touristic environment fosters a peaceful living experience.
– Integration opportunities with friendly local community and expats.
– Clean air quality enhances overall well-being and health.
– Reliable internet connectivity for remote work or leisure.
– Access to quality educational facilities for families and individuals.
❌ Cons
– Limited nightlife options might leave some nightlife seekers disappointed.
– Small-town charm may feel too quiet for some residents.
– Language barrier can complicate daily interactions for newcomers.
– Public transportation options may be limited outside main routes.
– Some local services may have reduced hours or availability.
– Cultural activities may not always cater to diverse interests.
– Seasonal weather changes can affect outdoor lifestyle preferences.
– Limited selection of international cuisine may frustrate foodies.
– Local events may not match the vibrancy of larger cities.
– Integration into local community can take time and effort.
Related Posts
More questions about Vittorio Veneto ? Ask Magic AI.
Our innovative AI assistant is eager to help. Try it out here: